
406.587.4531
simmental@simmgene.com
406.587.4531
simmental@simmgene.com
A Closer Look at the CE Updates for the Simmental Breed
Update December 20, 2025
by Dr. Elizabeth Dressler, ASA Lead Geneticist
What changed in the calving ease evaluation?
International Genetic Solutions (IGS) recently made updates to how calving ease direct (CED) and calving ease maternal (CEM) EPD are calculated. Across IGS, the “before” and “after” CE EPD line up very closely; most cattle did not change rank due to the updates (0.90 correlation). The definitions of CE EPD and how to use these EPD have not changed.
-
CED is the difference in probability of calves being born unassisted out of first-calf heifers. Breeders should continue to use the CED EPD when selecting bulls to be bred to heifers.
-
CEM is the difference in probability of daughters calving unassisted as first-calf heifers. Breeders should continue to use the CEM EPD when selecting bulls to make future replacement females.
More information on the technical details of the updates can be found in the November 23 update below.
How much did CE EPD change?
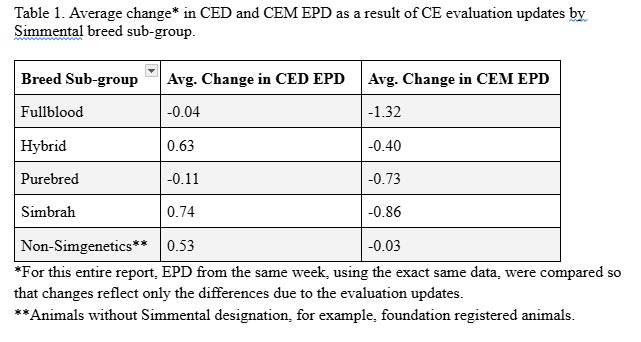
Let’s compare CE EPD before and after the updates to see how they actually changed across the entire Simmental breed. In looking at all the animals in the Simmental database (> 5 million animals), the average change in CED EPD was +0.326. That means that CED for Simmental animals increased by about a third of a calving ease unit, on average. The average change in CEM EPD was -0.512, or decreased by half of a calving ease unit. Most Simmental producers saw only small moves in CED and CEM. The average change experienced by different Simmental breed sub-groups is shown in Table 1.
Looking at the average change across all Simmental animals gives us a good starting point. But we can dig a little deeper into how many Simmental animals saw small, moderate, or large changes. Figure 1 shows the percentage of animals in the Simmental database that experienced different levels of absolute CED change. This figure shows the absolute change, or the size of the change regardless of whether it went up or down. For example, the red bar represents the percentage of animals that experienced a CED change of less than one in either direction (positive or negative).
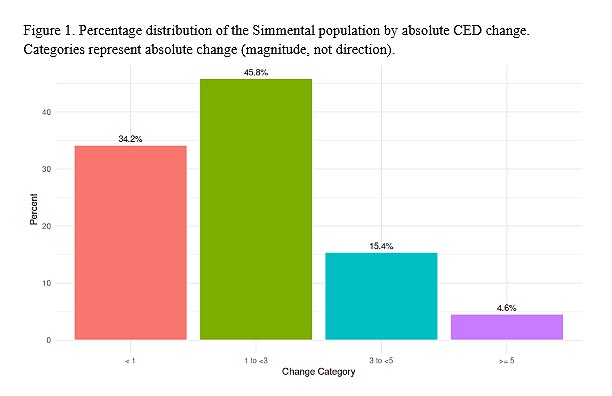
For 80% of the Simmental population, CED changed by fewer than ± three assisted calvings per 100 births (± three CED units). Only a very small portion of the Simmental population, fewer than 5%, saw changes greater than ± five assisted calvings per 100 births (± five CED units).
As an example, if your animal’s CED EPD changed from 12.0 to 10.0, that animal would fall under the green bar on the above graph. The two-unit decrease in CED means that we would expect two more out of 100 of his calves to require assistance.4
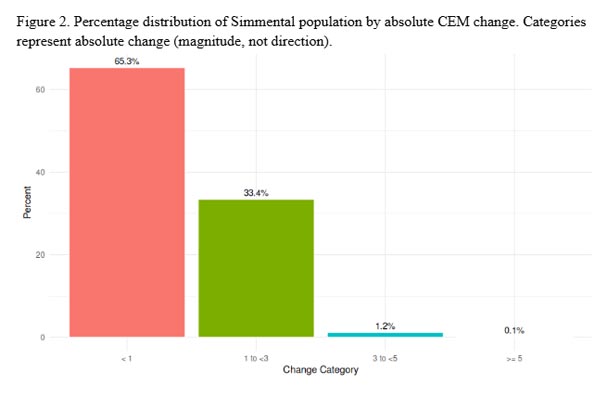
Most animals moved less than one CEM unit. Only 1.3% of the population experienced a change larger than three units in either a positive or negative direction.
Did the update affect all Simmental sub-groups the same?
Most animals moved less than one CEM unit. Only 1.3% of the population experienced a change larger than three units in either a positive or negative direction.
Did the update affect all Simmental sub-groups the same?
Next, we can look at the absolute changes in CED and CEM by Simmental breed sub-group to see if one sub-group was affected more than another. Figures 3 and 4 show the distribution of absolute change experienced by each breed sub-group for CED and CEM, respectively.
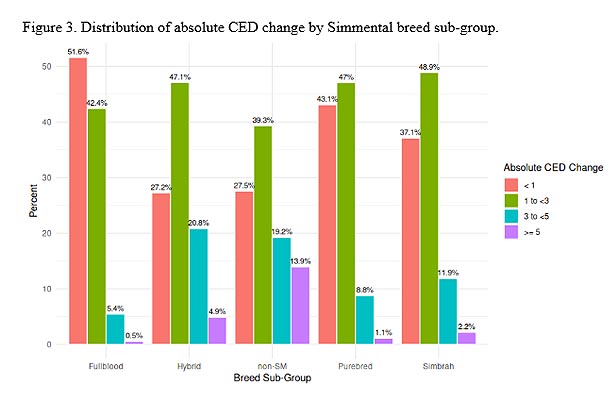
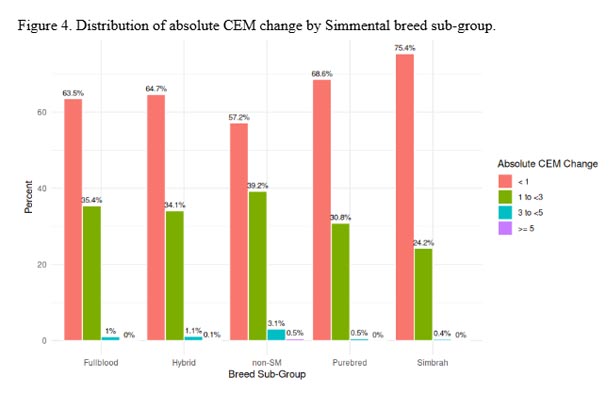
The absolute changes in both CED and CEM experienced by each breed sub-group are very similar.
Each breed sub-group underwent the same CE updates and experienced similar amounts of change. In fact, IGS does not see or have access to Simmental breed sub-group information in the evaluation.
Why do the percentile ranking tables look different?
ASA members should use the current percentile ranking tables available here. It is important to keep in mind that the percentile tables are calculated for the “current generation” in the ASA database. This is because over time the Simmental breed has made genetic progress. The percentile rankings are meant to be a comparison tool that can be used when making current selection decisions. In other words, Simmental breeders have made great progress in CE since the 1990s and cattle from that decade are not typically selection candidates; therefore, those cattle are not included in the calculation of percentile tables.
If you quickly compared the percentile tables before and after the update, it would lead you to think that the average CE of purebred (and other breed sub-groups) has gone down. But this is not true and doesn’t tell the full story. Again, this is because percentile tables are calculated based on the current generation, or only a portion of the animals in the ASA database. In contrast, this analysis was conducted on the entire ASA database — keep in mind that IGS estimates EPD for all animals in the database, not just the young ones. In other words, that’s why the average change in CED described above (+0.326) doesn’t line up with what you may have noticed in the percentile ranking tables; they’re based on different datasets. Figure 5 may help further explain this point.
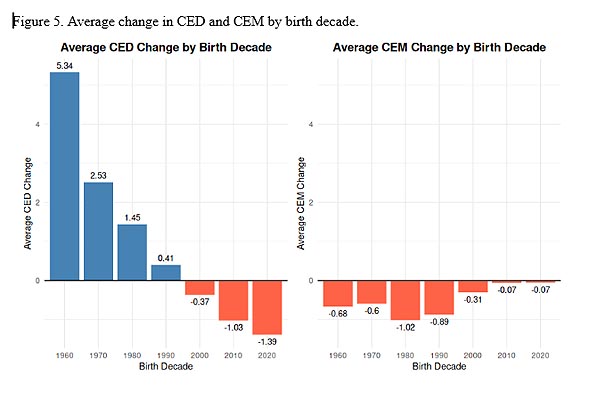
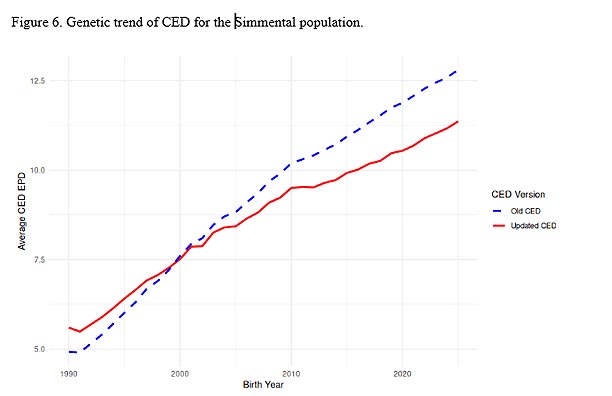
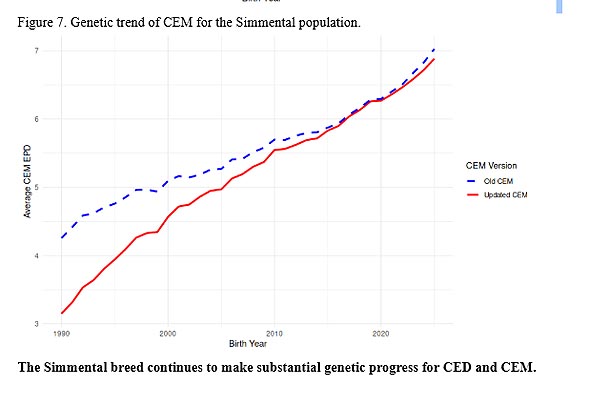
Figure 5 shows the average change in both CED and CEM by animal birth decade. Animals born in the recent decade saw CED decrease on average, which lines up with what you may have noticed in percentile ranking tables. Animals born in the recent decade saw very little change in CEM, on average. This does not mean that younger animals are worse than older animals. This graph just shows the average change animals born in that decade experienced. For example, animals born in 2020 had CED decrease by -1.39 on average, while animals born in 1980 had CED increase by 1.45 on average. Even though younger animals saw slight decreases in CED with the updates, the overall breed trend still shows significant improvement over time. CED and CEM in the Simmental breed are still trending in a positive direction reflecting the great progress Simmental breeders have made over time as shown in Figures 6 and 7.
What does all this mean for me?
-
Continue to interpret CED as the difference in the probability of calves being born unassisted out of first-calf heifers and CEM as the difference in the daughters’ ability to calve unassisted, but these EPD are now backed by a more refined model.
-
The practical advice does not change: use CED when selecting heifer bulls, use CEM when thinking about the kind of daughters you want to keep.
-
Make sure to use the current percentile tables for comparisons.
-
These updates have increased prediction accuracy, meaning the EPD are now doing a better job of predicting the true genetic merit of that animal for CE.
-
These updates have increased the efficiency of the IGS evaluation, allowing IGS to continue providing you weekly EPD.
-
These updates reflect IGS’s goal to give members better, more accurate selection tools, which is a win for the entire beef industry.
-
Members who have questions about the updates and/or specific animals are welcome to reach out to Drs. Elizabeth Dressler, Jon DeClerck, or Jackie Atkins.
Subscribe to eNews ASA's weekly newsletter.
Sales Call: Calendar of upcoming sales and
eBlast: Sales and other industry promotions